Who can use this: Business admin
Available on: Gong Forecast
Ideal for: RevOps
.png?sv=2026-02-06&spr=https&st=2026-08-03T07%3A06%3A41Z&se=2026-08-03T07%3A17%3A41Z&sr=c&sp=r&sig=CNiwgiT9RBDUXmMnYupqj4gaYZeGZCYN2wg0YcJoVvc%3D)
What’s a changes widget
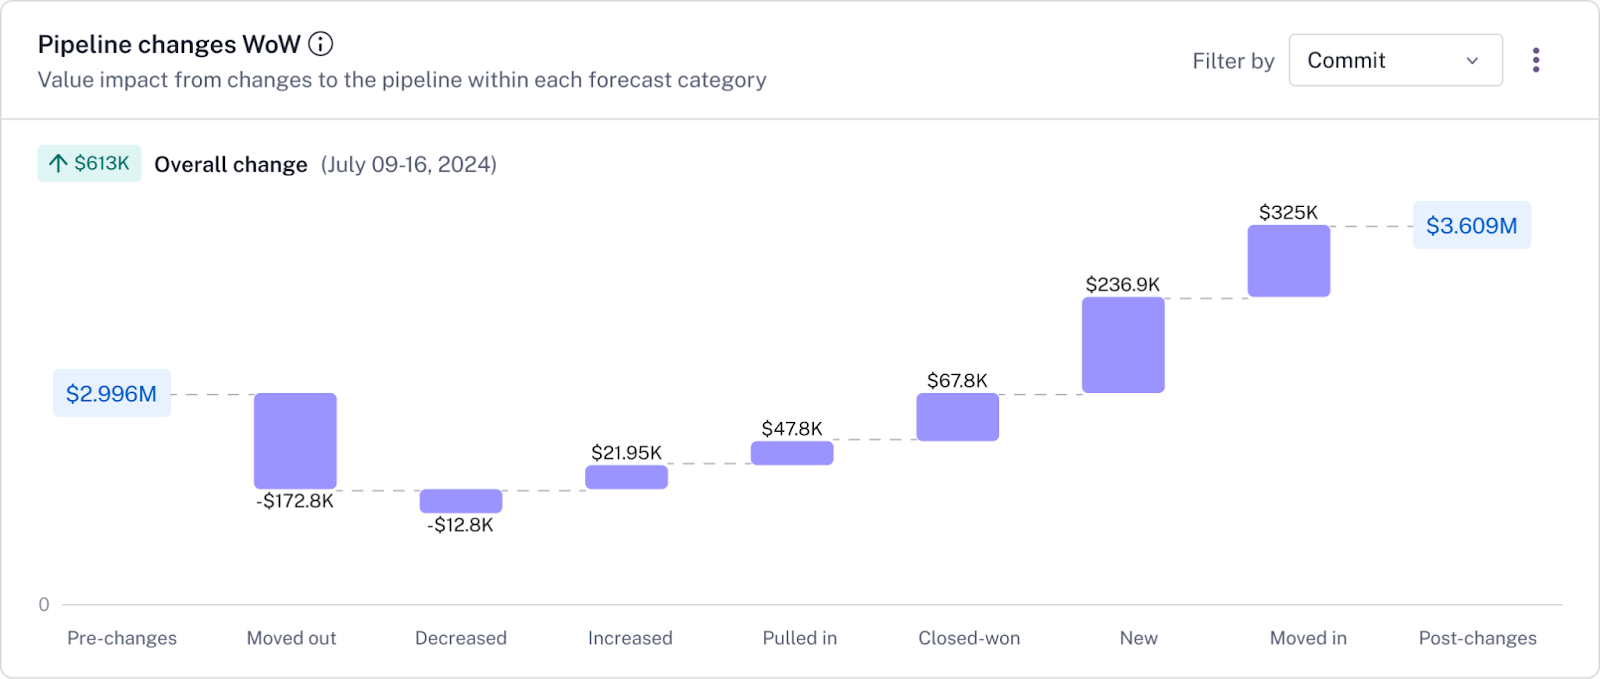
The changes widget visualizes how the total amount in each forecast category changed over a selected period for a selected line of business. The chart shows the reason for the change, such as deals pushed out to future periods, amount decrease/increase, and deals that ended up being closed-lost.
Learn more about changes reports here.
.png?sv=2026-02-06&spr=https&st=2026-08-03T07%3A06%3A41Z&se=2026-08-03T07%3A17%3A41Z&sr=c&sp=r&sig=CNiwgiT9RBDUXmMnYupqj4gaYZeGZCYN2wg0YcJoVvc%3D "image(415).png")
Building a changes widget
Note:
Your profile must include the relevant permission to create and manage widgets to dashboards
To build a new changes widget:
Select your dashboard, click +New widget and select Changes from the gallery.
.png?sv=2026-02-06&spr=https&st=2026-08-03T07%3A06%3A41Z&se=2026-08-03T07%3A17%3A41Z&sr=c&sp=r&sig=CNiwgiT9RBDUXmMnYupqj4gaYZeGZCYN2wg0YcJoVvc%3D "image(416).png")
In the dashboard header, click the edit icon
 to rename your widget and, optionally, + Add description.
Under Line of business, select the line of business for the widget.
Under Forecast, select the default forecast category to include in the widget. If you want viewers to not be able to change this selection, uncheck Add dropdown to widget.
Under Changes tracked, select the time interval for the tracked changes.
Under Select team and period, you’ll notice the team member and date fields are set to be dynamic and respond to whatever is selected in your dashboard. You can change them to fixed values.
Note:
If you select fixed values for the team member and period, the widget would no longer respond to selections made on the dashboard level.
Play with the preview option on the right. You can click the Pre-changes and Post-changes bars to drill into the deals behind the changes, giving you a deeper understanding of how and why your pipeline moved.
When you’re happy with the preview result on the right, click Save.
 Visit our Academy and find out how to utilize your dashboards to boost efficiencies and refine revenue operations |